Seurat Analysis Workflow
scSpotlight uses the Seurat standard single cell
analysis workflow, we recommend new users going through their pbmc3k
tutorial to better understand each processing step. The
demonstration dataset used is a 2,700 Peripheral Blood Mononuclear Cells
(PBMCs) sample made publicly available by 10X Genomics. The matrix could
be downloaded here.
A typical seurat analysis workflow is like below:
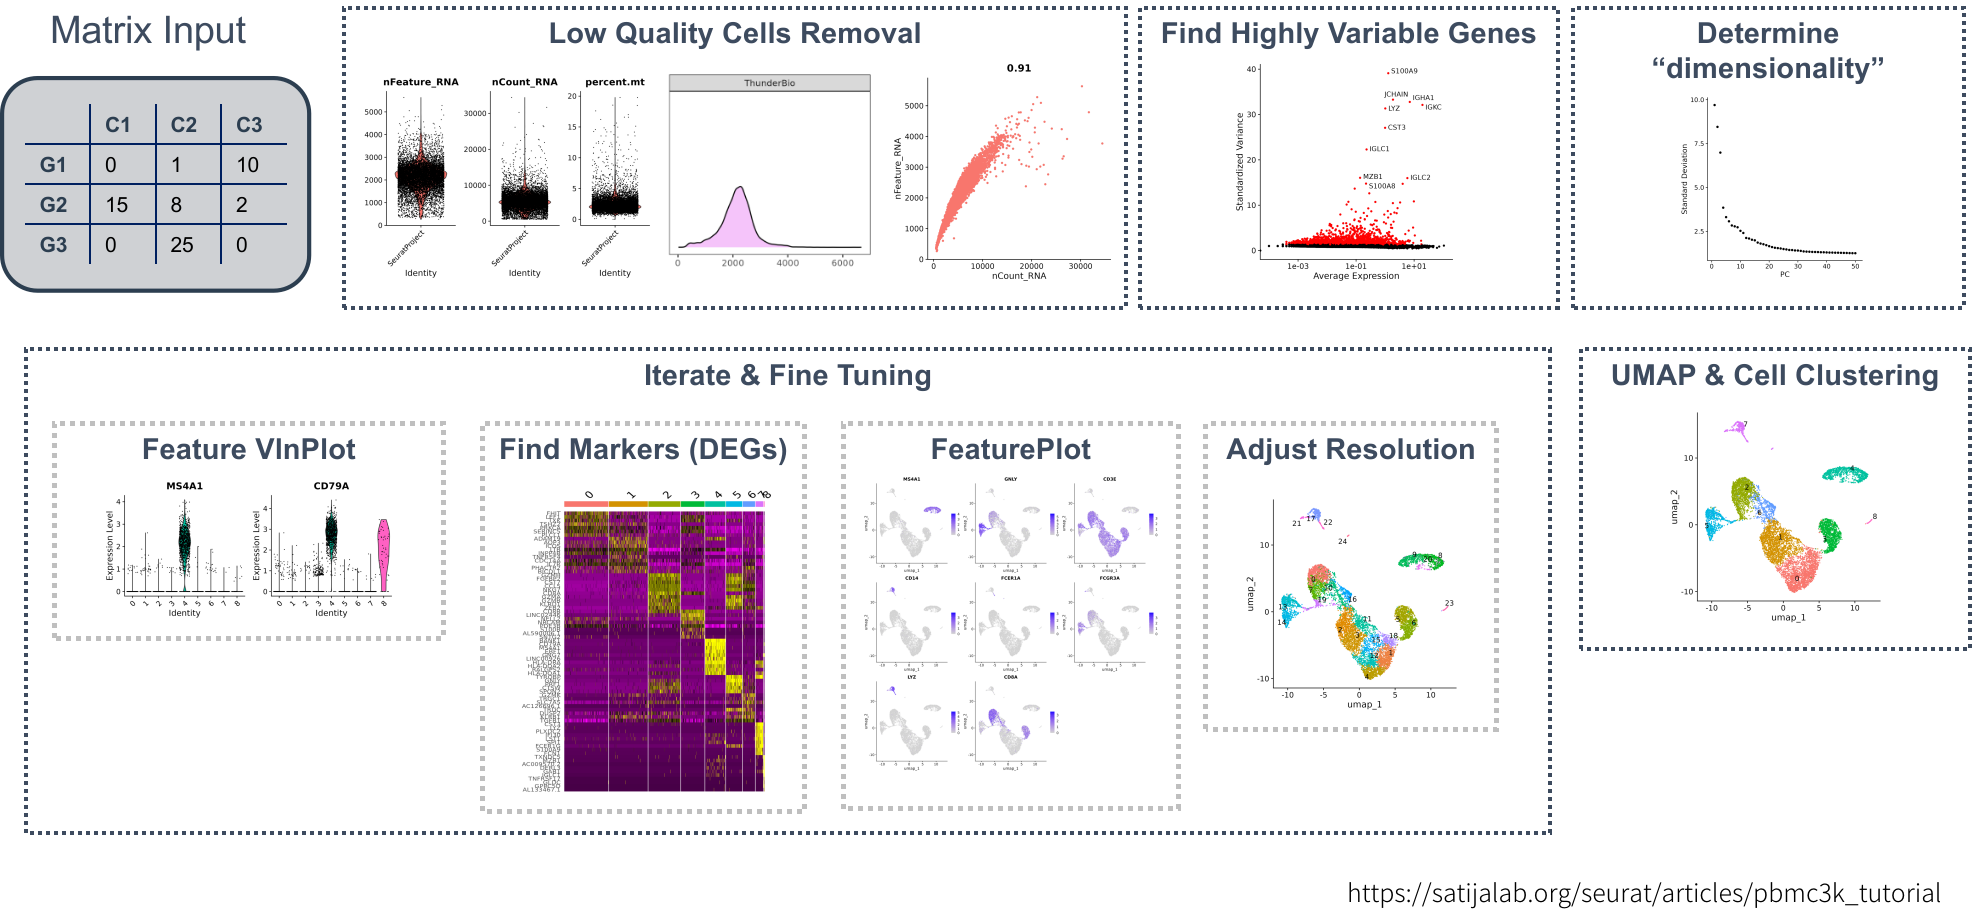
Invoke App
To start using scSpotlight, please use the command below and access
the app via: 127.0.0.1:8081
The default mode of app is processing. User could also
change mode to viewer, which will only allow illustrating
dataset and querying gene expressions:
If one needs to load a very large dataset, use dataDir
parameter to mount data directory and load Rds file
directly.
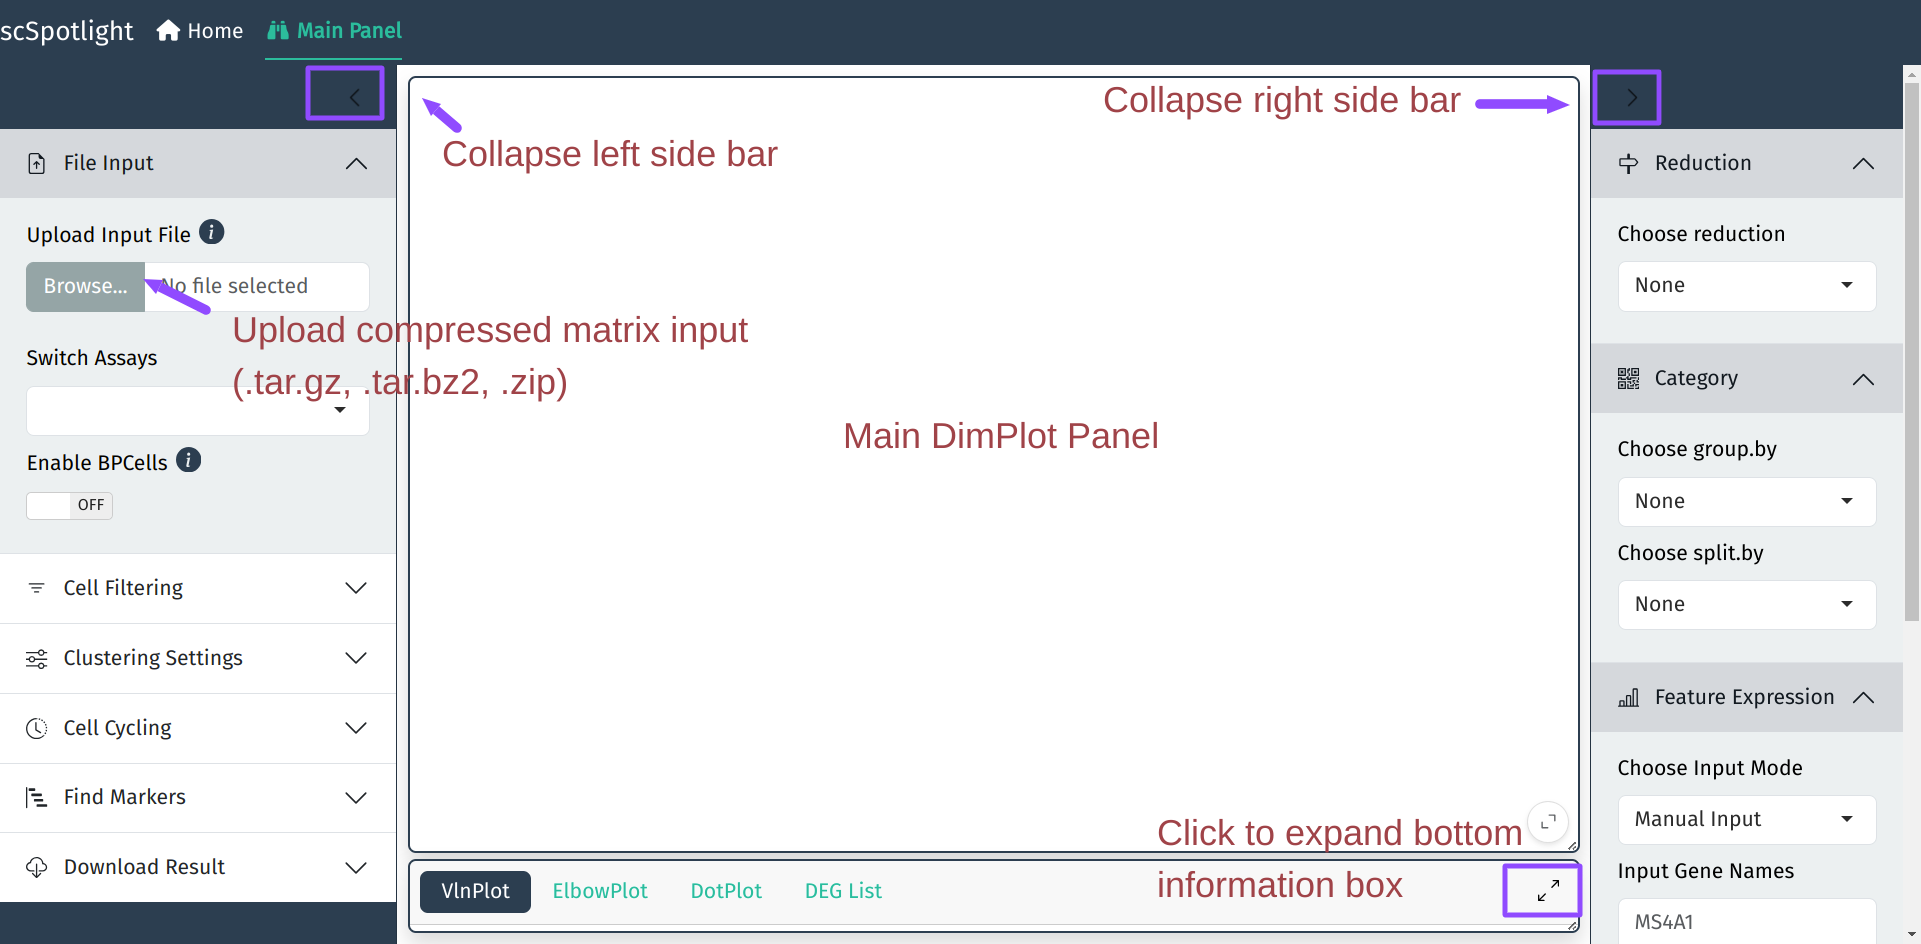
Input Files
Under the “processing” mode, scSpotlight supports
compressed file containing typical 10X cellranger output (Matrix Market
Format):
$ tar -tvf PBMC_demo.tar.gz
drwxrwxr-x xzx/xzx           0 2024-01-11 21:11 PBMC_demo/
-rw-r--r-- xzx/xzx    67972057 2024-01-11 21:10 PBMC_demo/matrix.mtx.gz
-rw-r--r-- xzx/xzx      294722 2024-01-11 21:10 PBMC_demo/features.tsv.gz
-rw-r--r-- xzx/xzx       46443 2024-01-11 21:10 PBMC_demo/barcodes.tsv.gz
and processed Seurat object seurat_processed.Rds saved
by [Seurat::SaveSeuratRds()].
If using compressed matrix file as input, scSpotlight will process data after loading without cell filtration and the dimension reduction will be shown.
Filter Cells
scSpotlight will automatically illustrate nGene (nFeature_RNA), nUMI (nCount_RNA), mitochondrial gene UMI percentage (percent.mt) and ribosomal protein gene UMI percentage (percent.rp) for each cell in VlnPlot panel. One could inspect the distribution and roughly evaluate the library quality. User could discard cells with too few or too many features detected and dying cells with high mitochondrial UMI percentage by adjusting parameters in the “Cell Filtering” block. The filtration step will also update highly variable genes (HVGs), the dimension reduction and the cell clustering result.
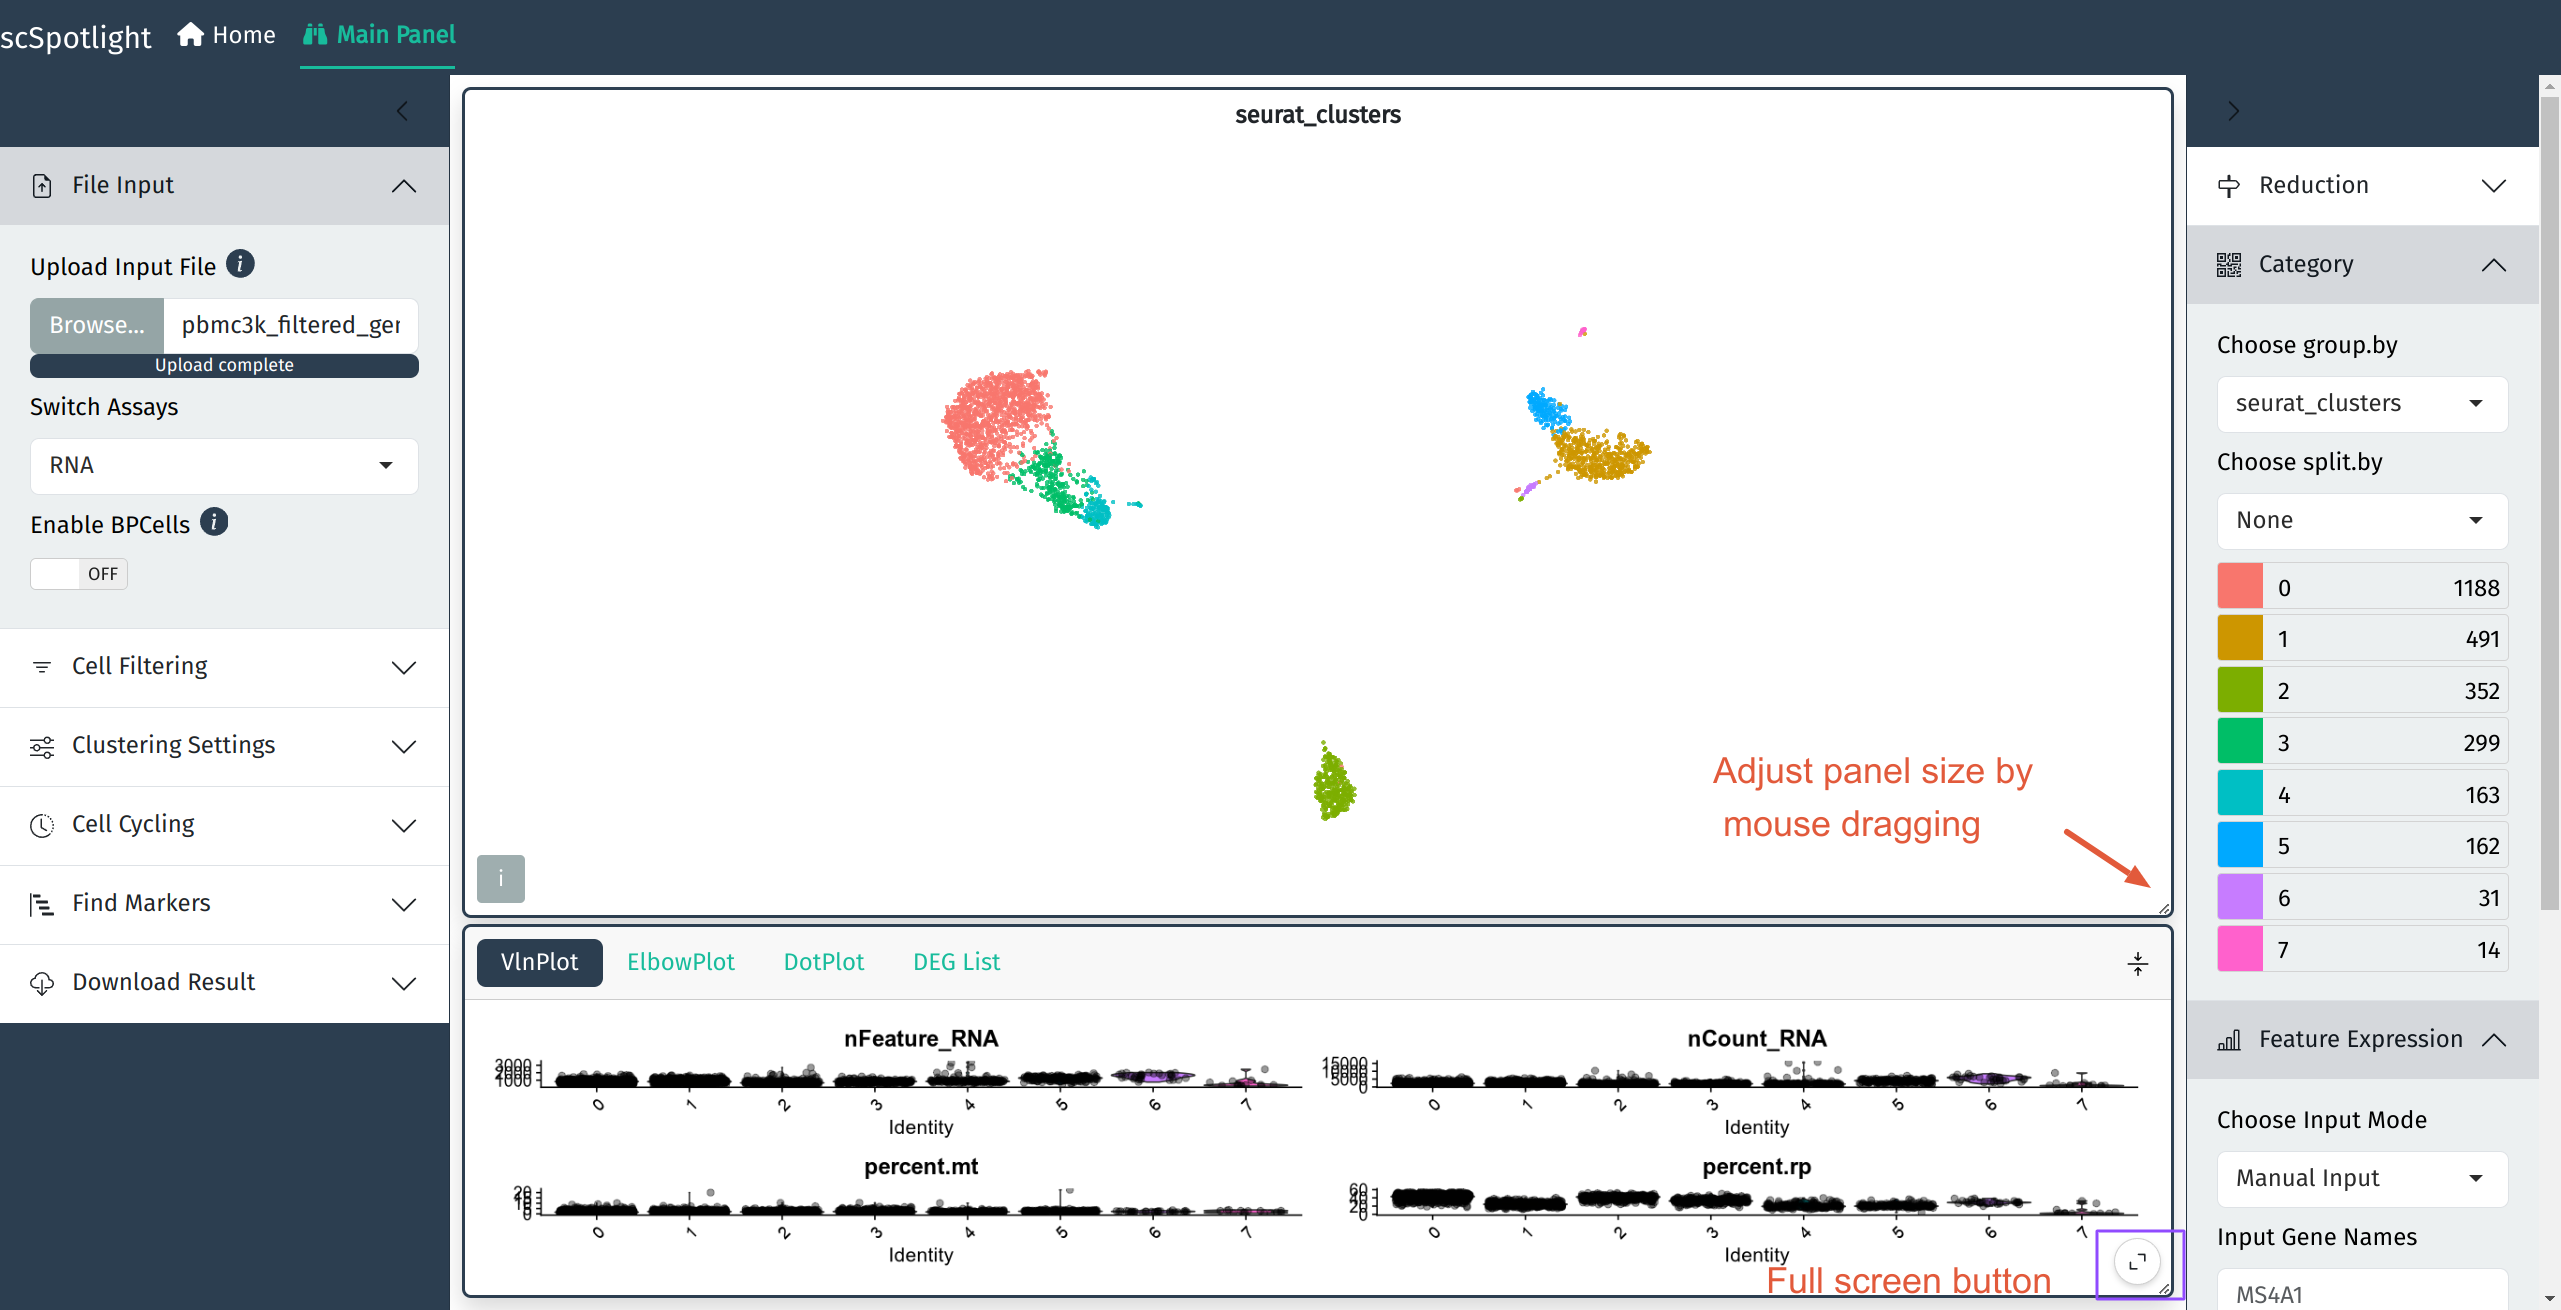
VlnPlot summarizes nGene, nUMI, percent.mt and percent.rp distribution
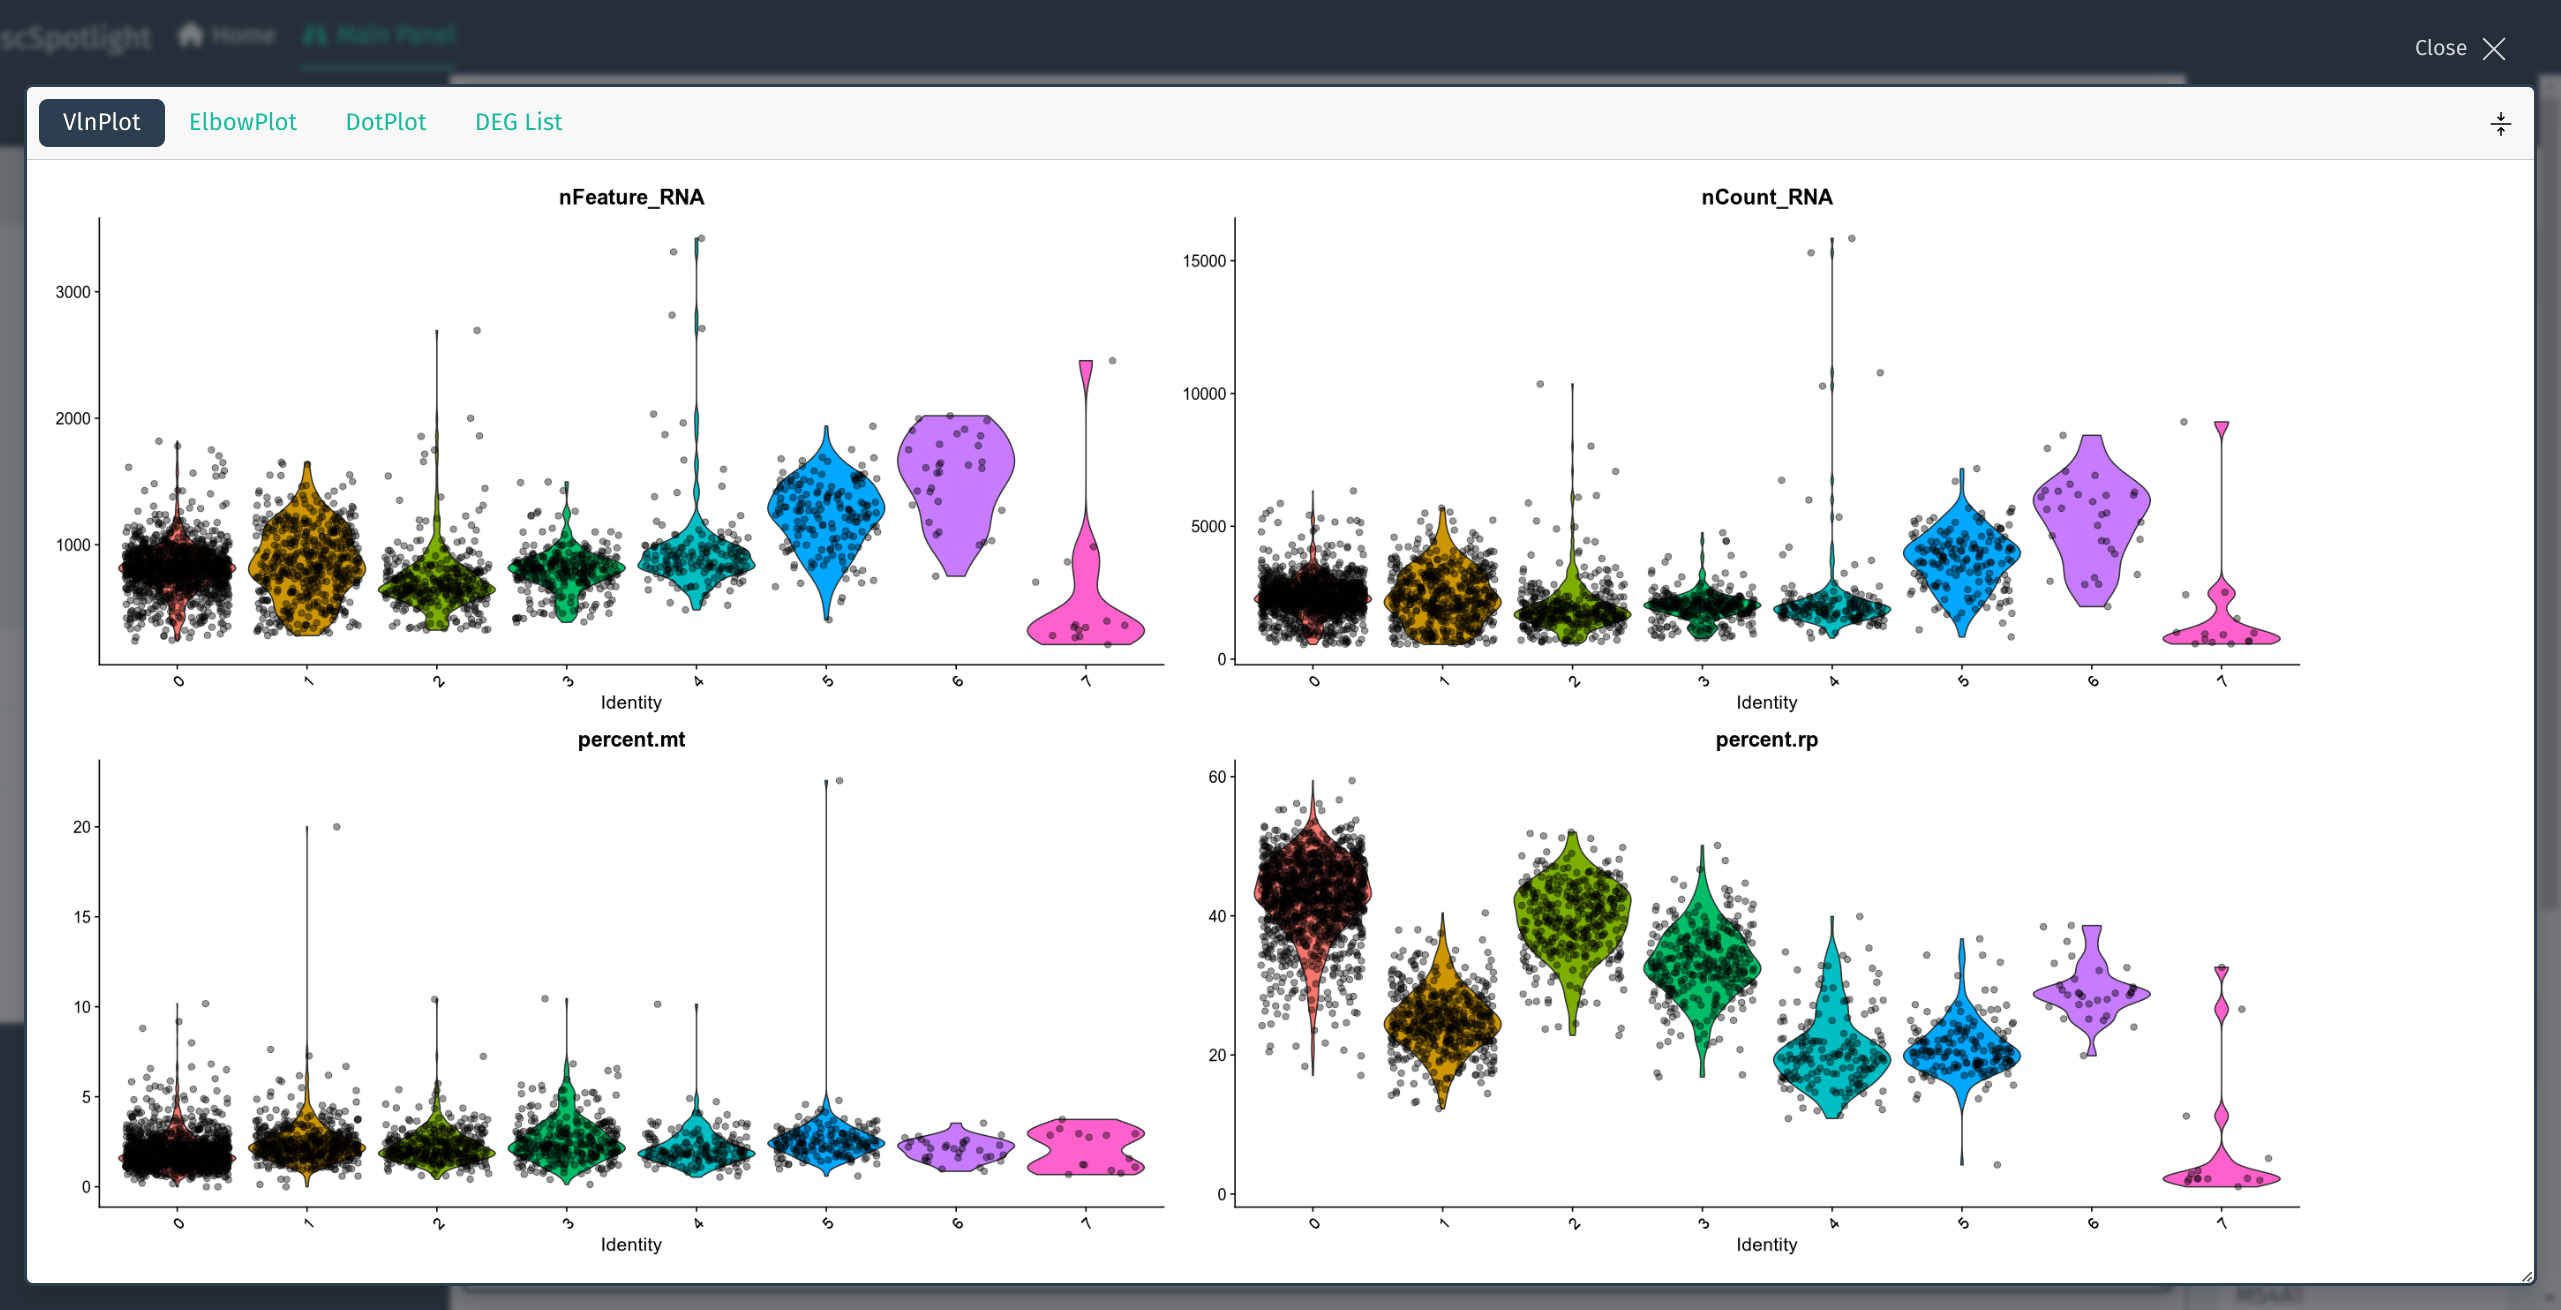
VlnPlot full screen
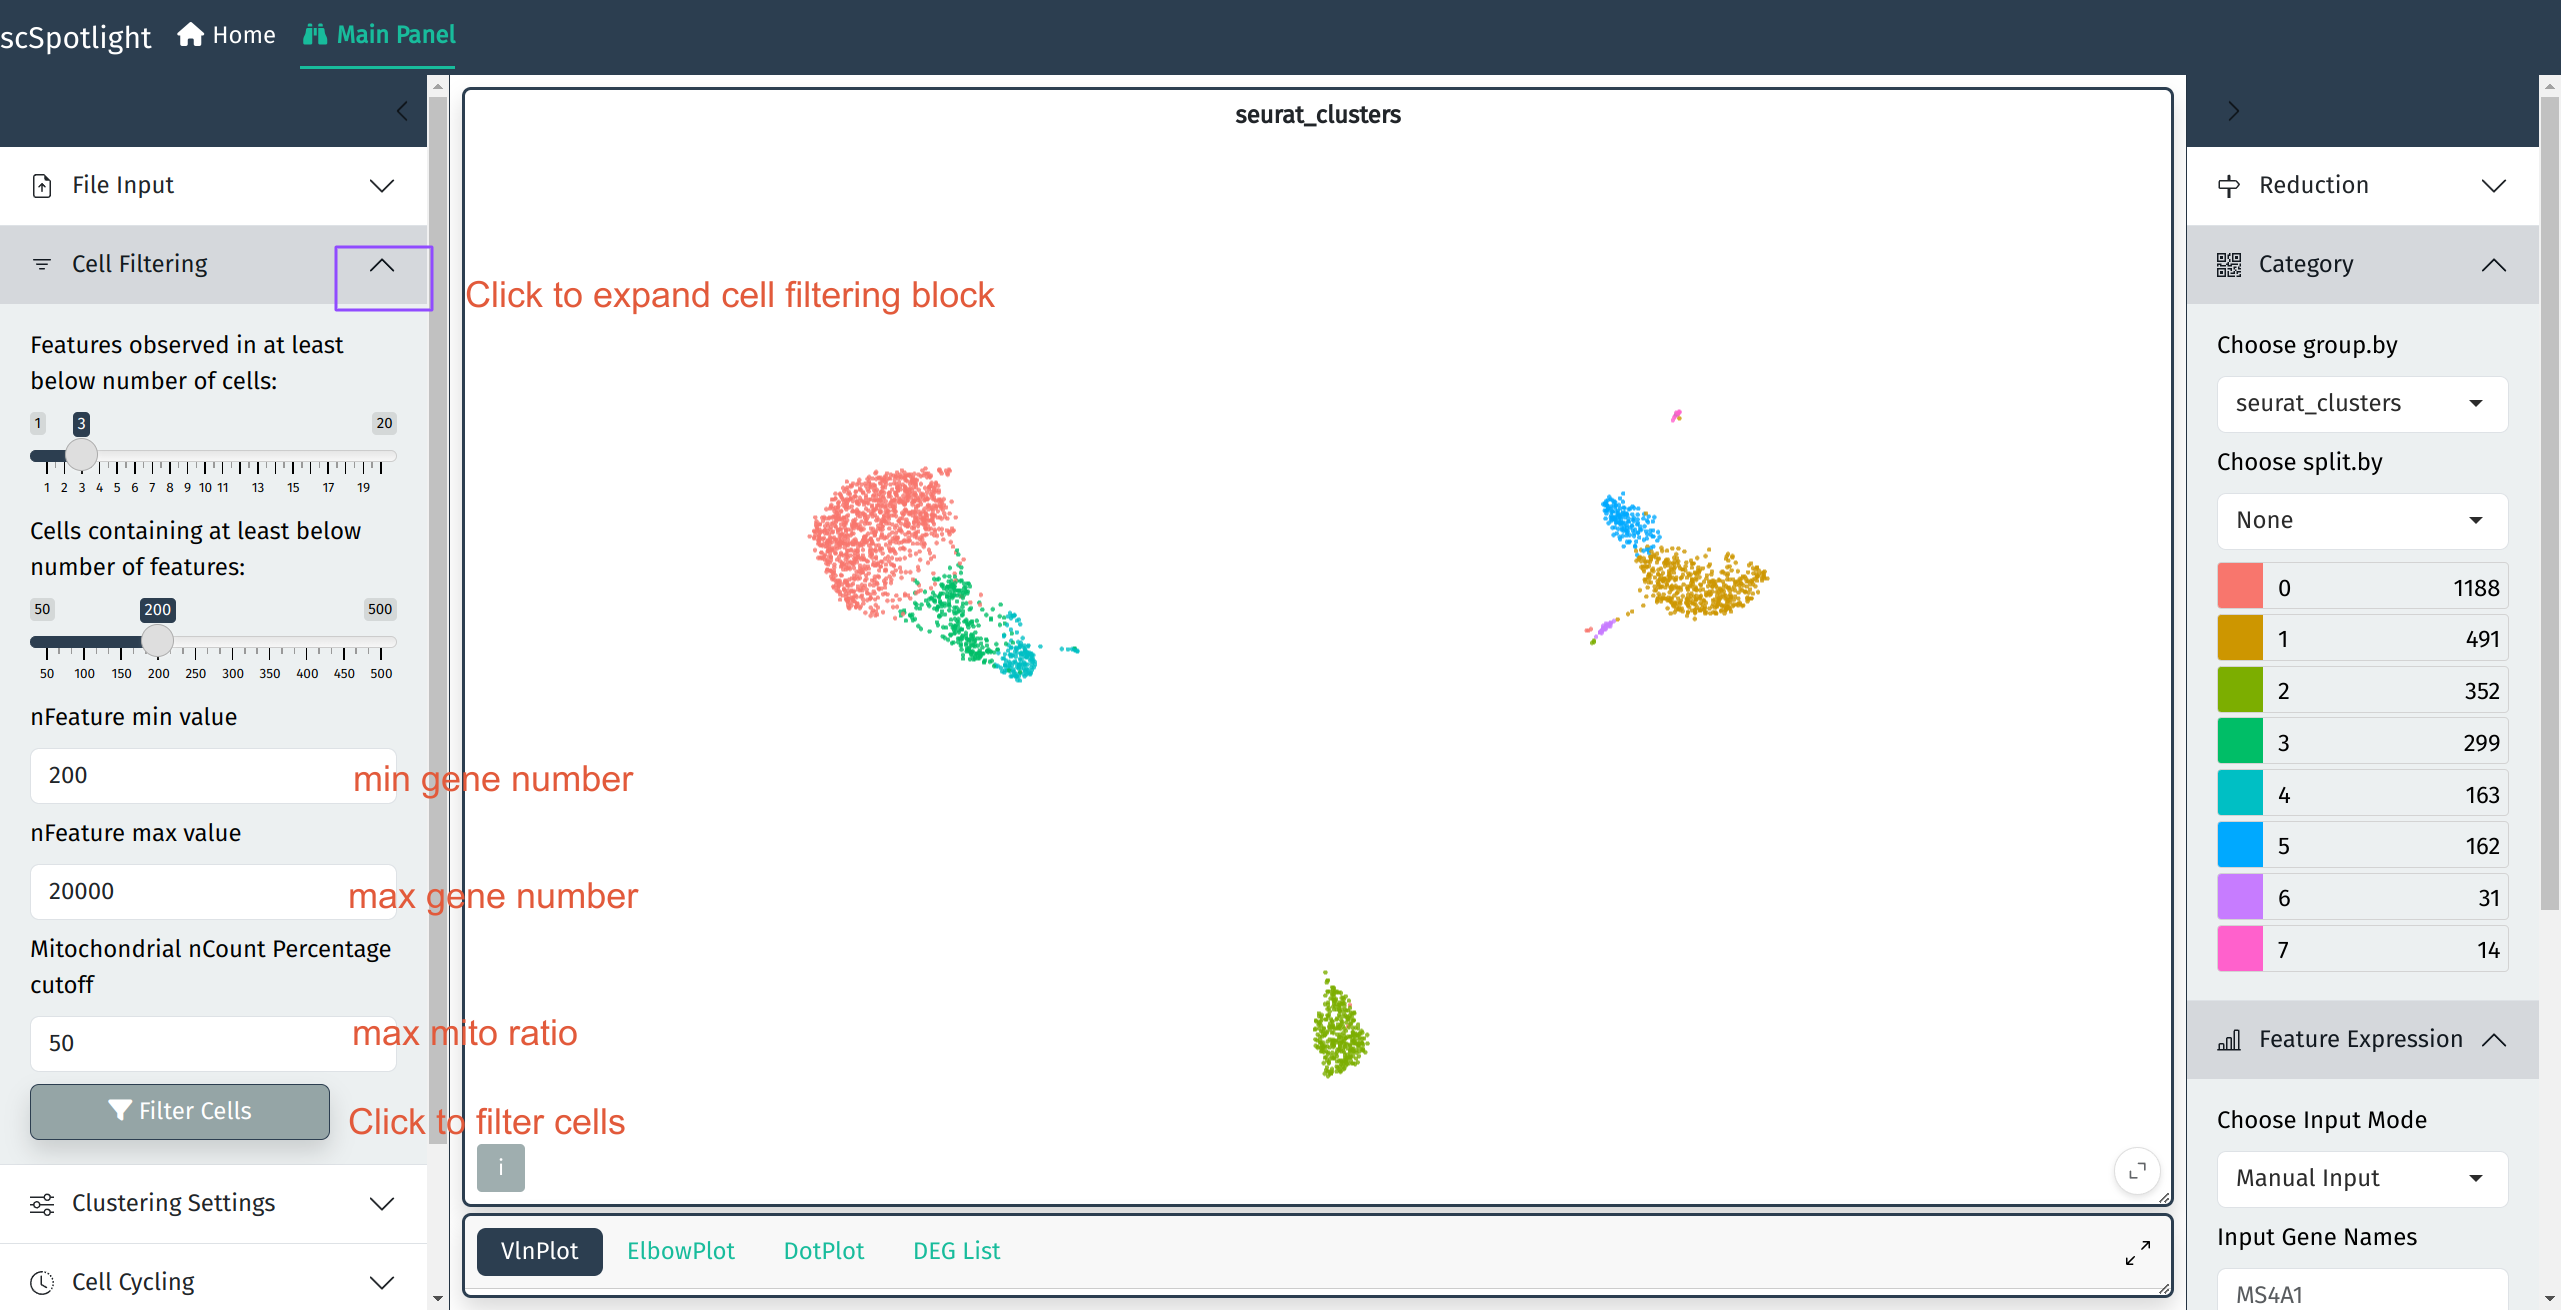
Cell filtration block
Highly variable features and Clustering
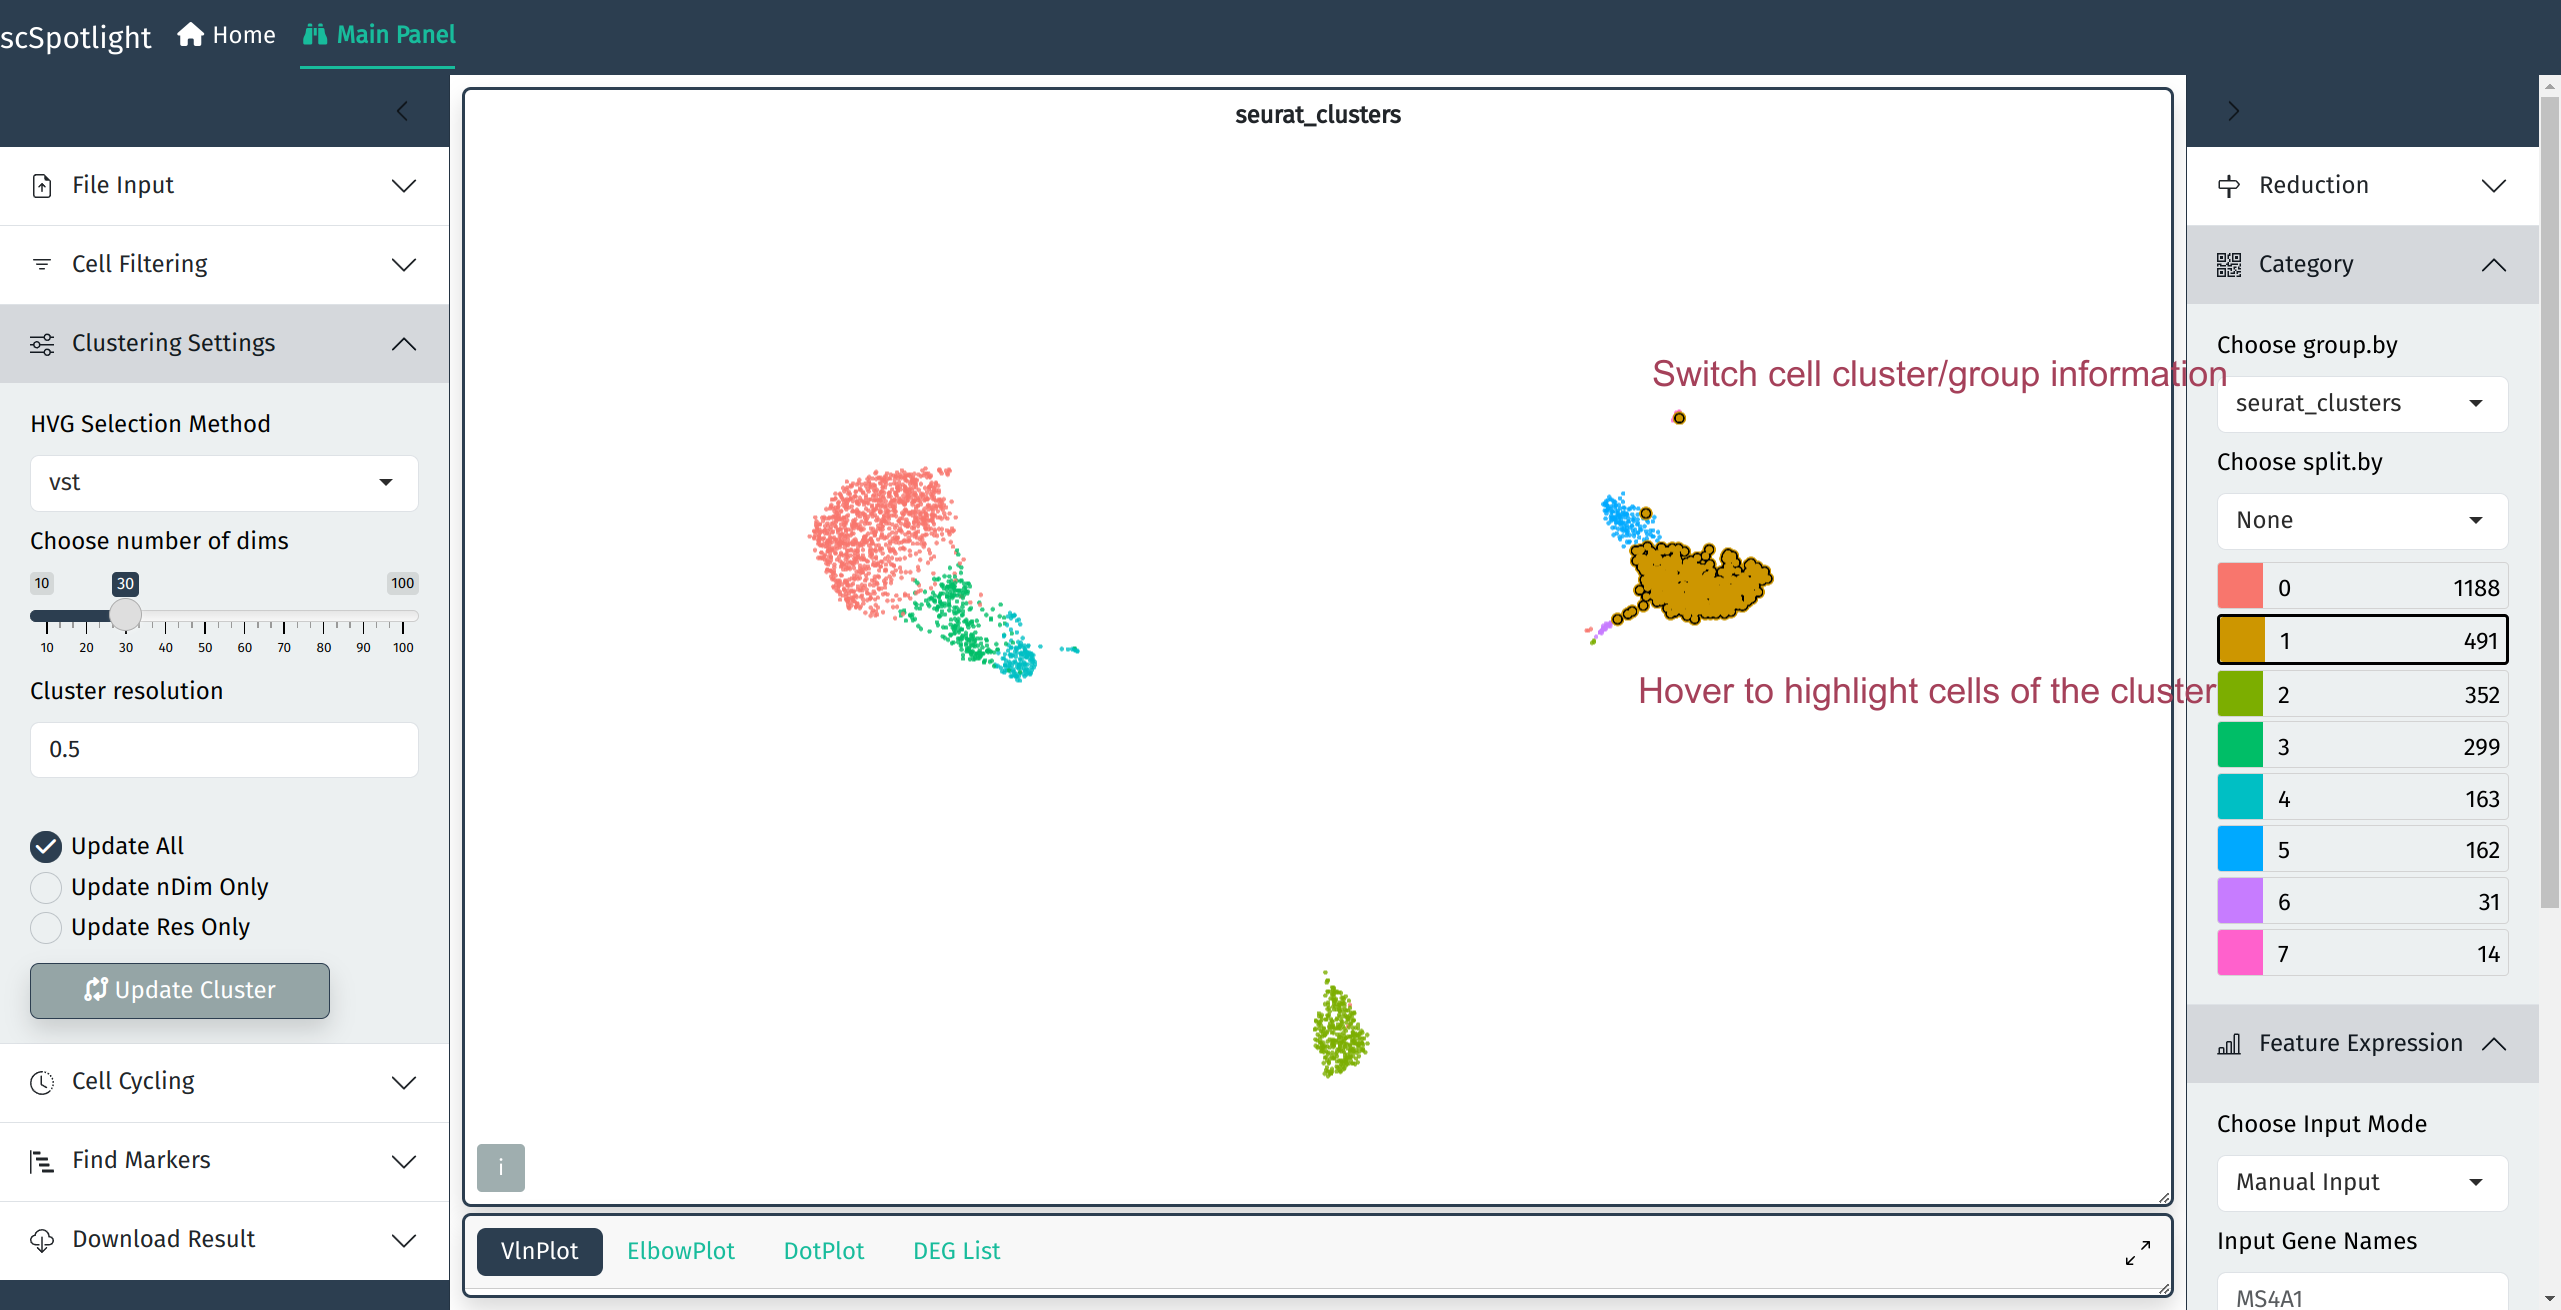
User will be able to adjust highly variable gene selection method and parameters related to unsupervised clustering.
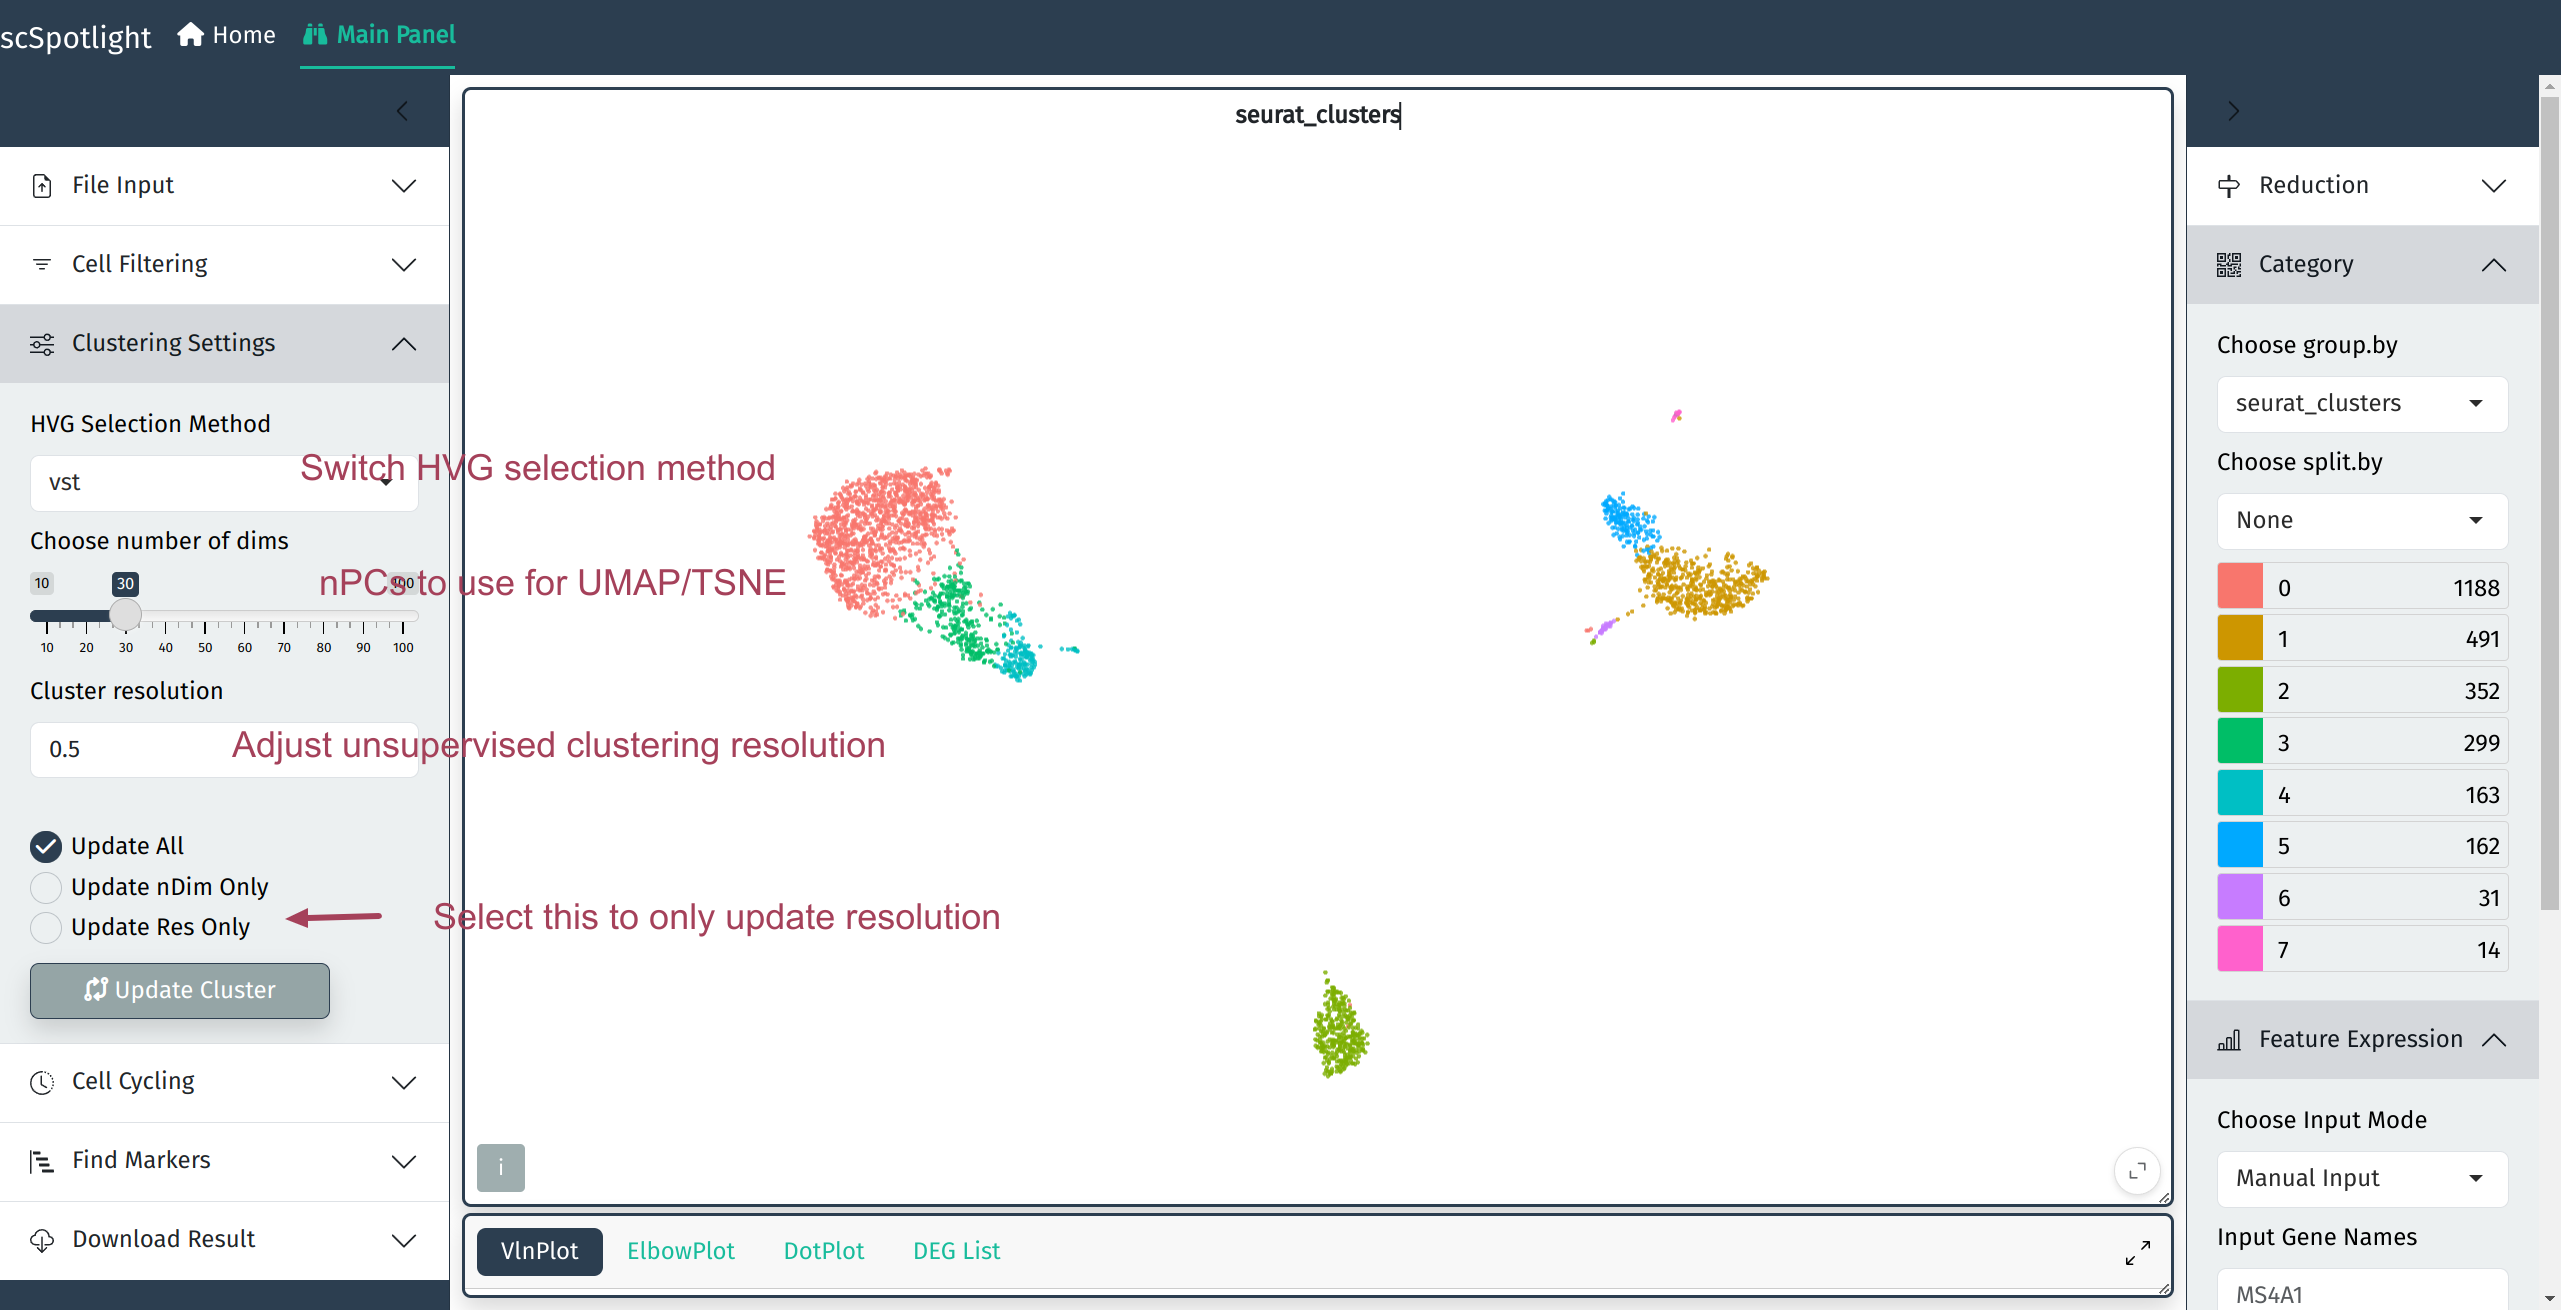
Clustering setting block
Gene expression
Input gene symbol to view its expression aside of the original cluster view
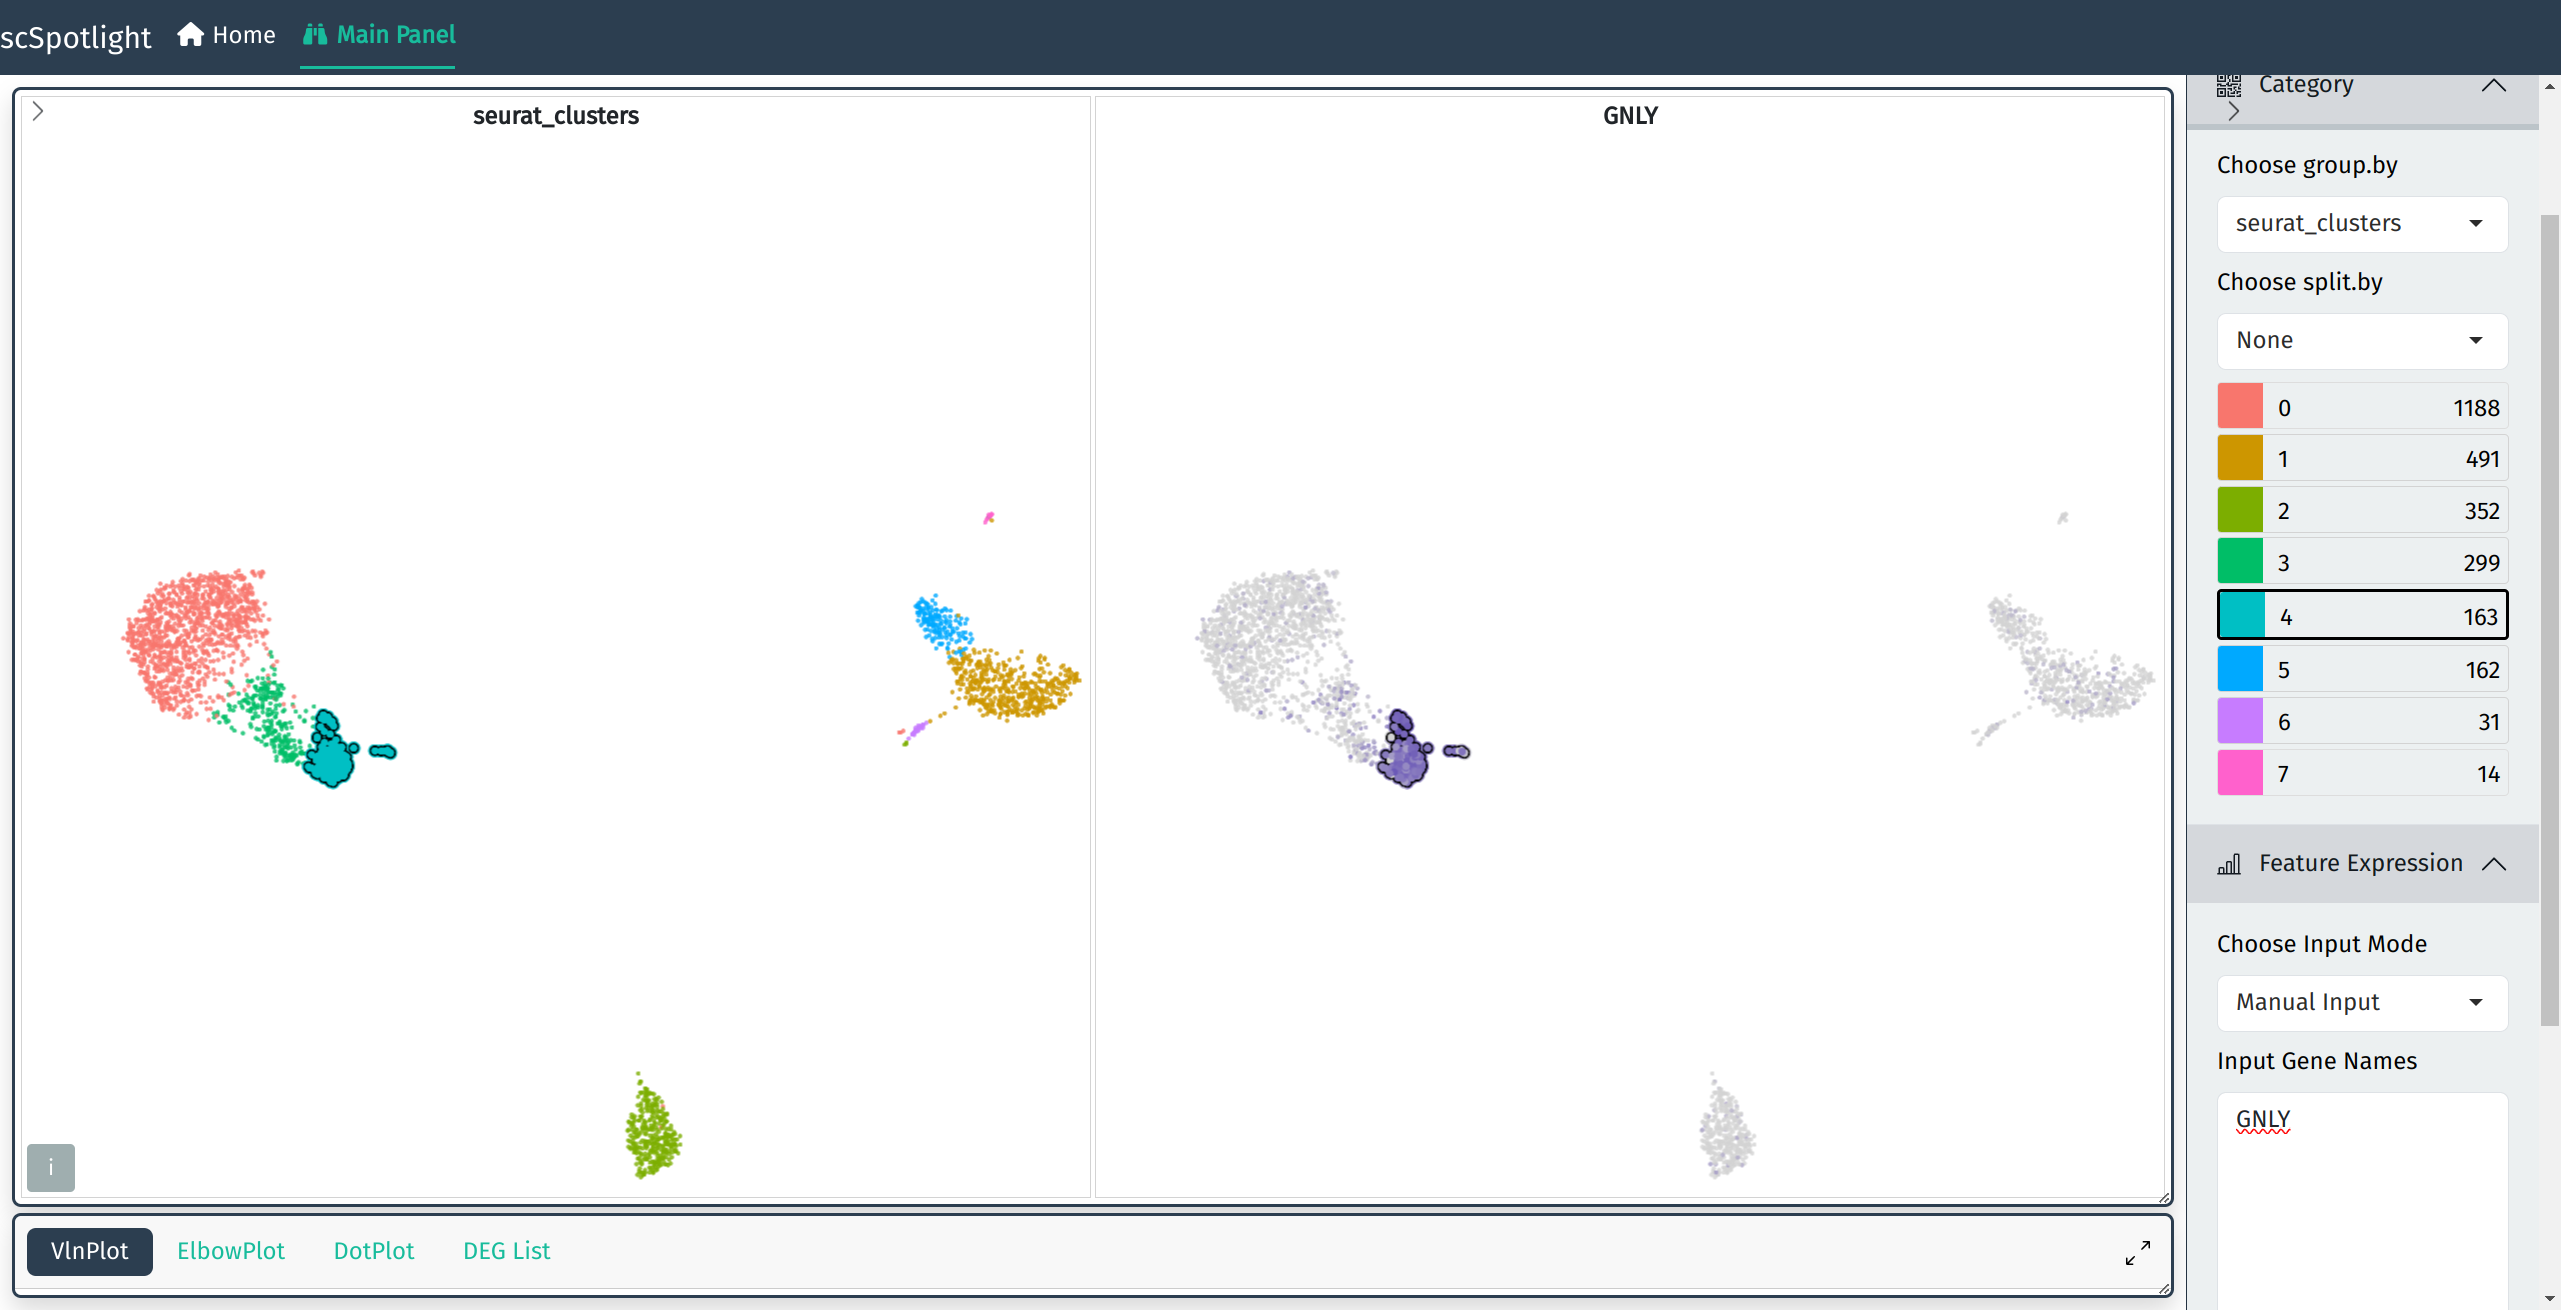
Single gene expression
Input multiple genes to view all of them via Seurat::FeaturePlot(), and click anyone of the subfigures to acitvate single gene view.
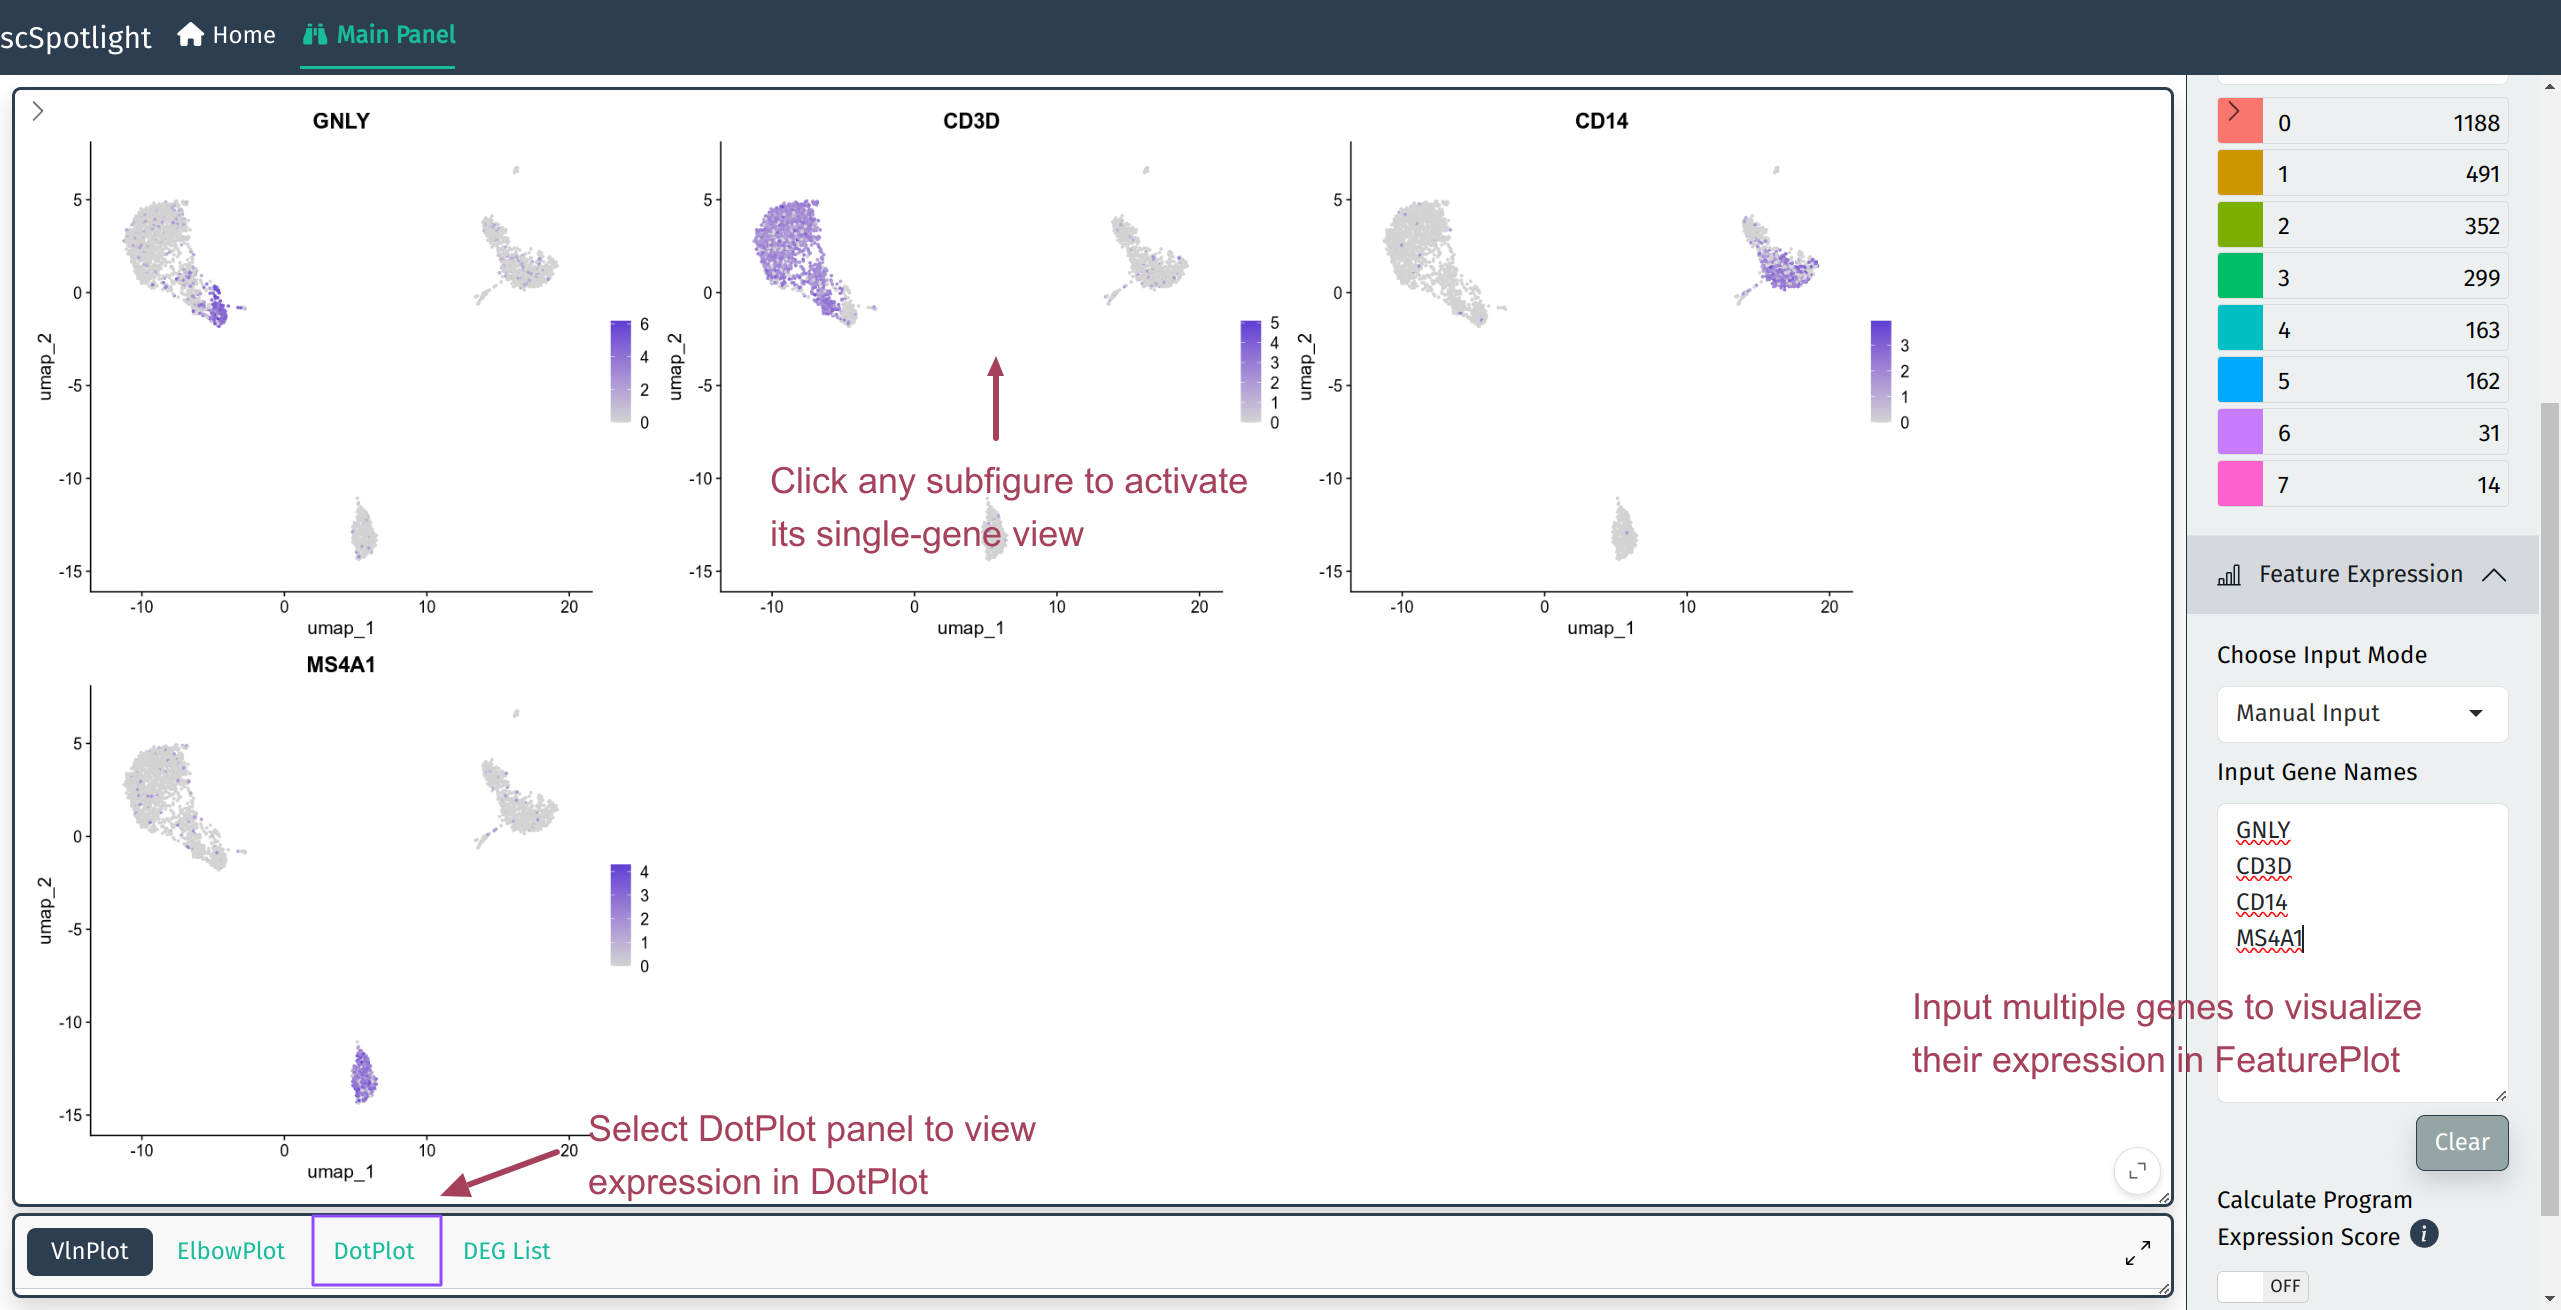
Multiple gene expression
Or view expression with Seurat::DotPlot():
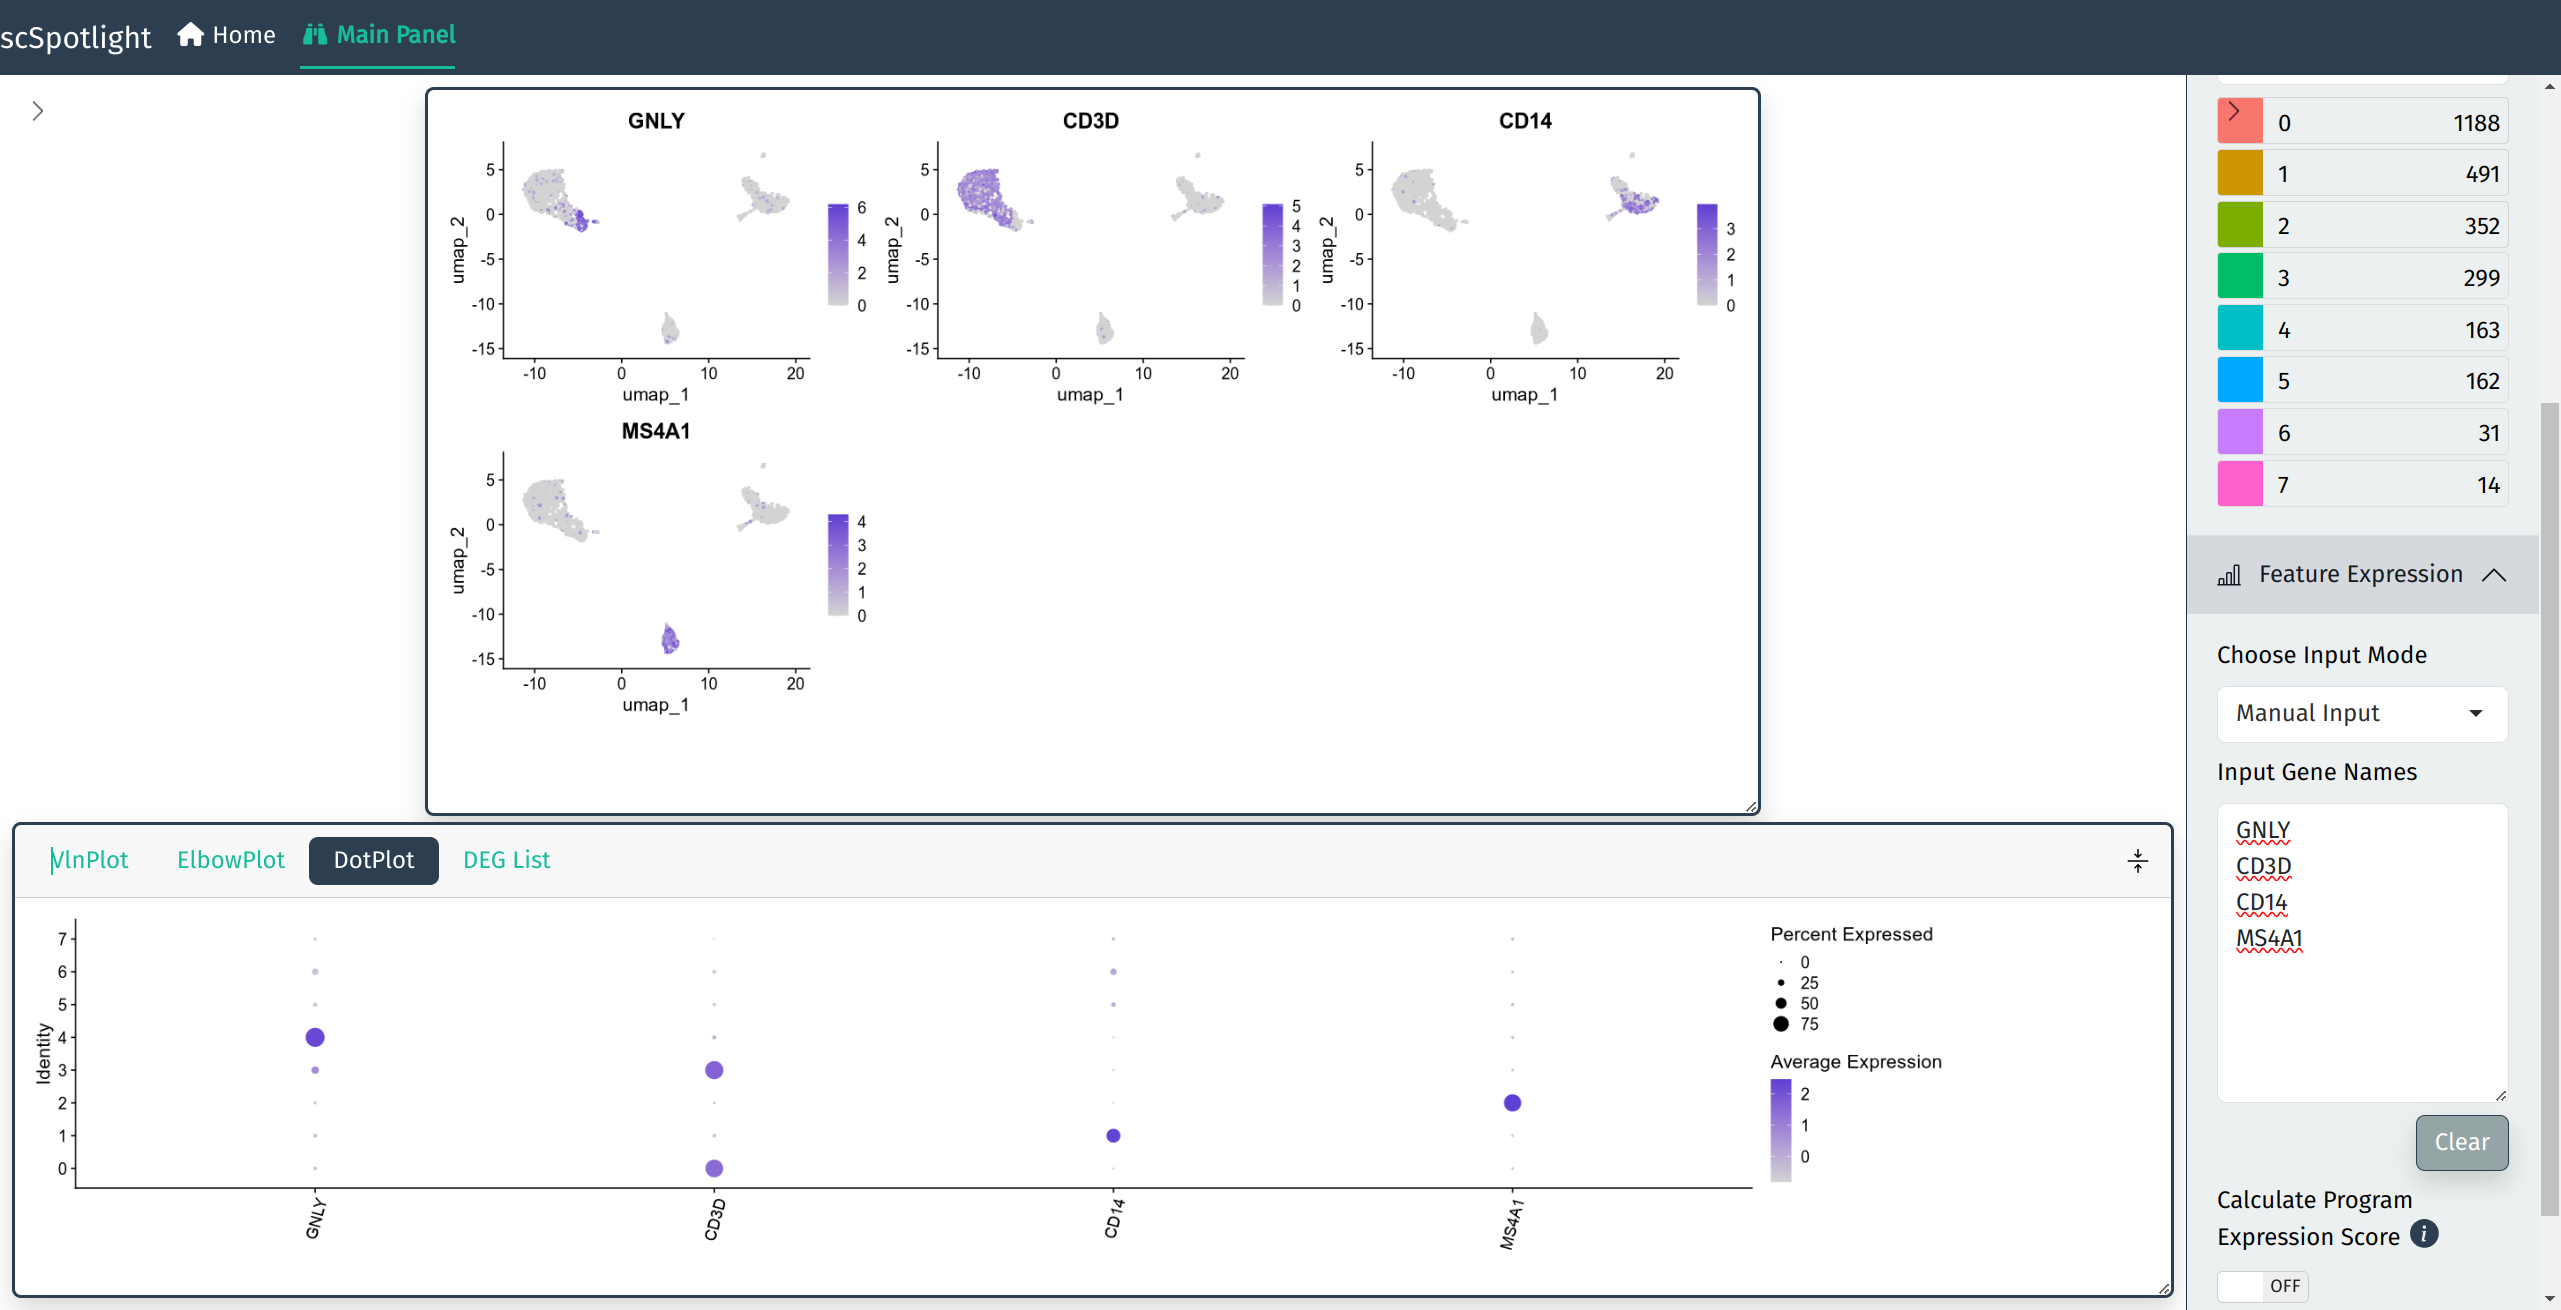
Gene expression DotPlot